The PhenoCam network is an ecological observatory with over 1000 automated RGB cameras installed on research towers around the world, several of which have been operating for over a decade. The millions of images collected at 30-min intervals are available in an open source format and used by scientists across the globe to study phenology: recurring plant life cycle events like leaf-out, flowering, and senescence. By looking at color data in Phenocam images, especially “canopy greenness”, scientists learn about the state and health of a landscape over time and compare ecosystem state with other measurements of ecosystem functioning, including carbon uptake and evapotranspiration fluxes.
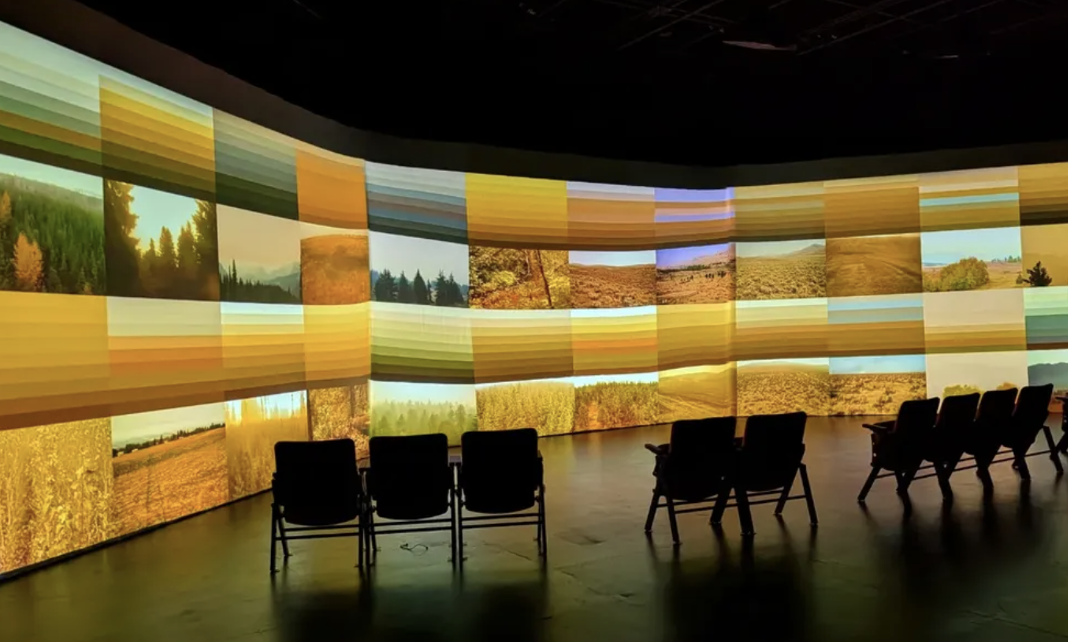
Informed by this color-driven research process and in discussion with Dr. Christopher Still, Professor of Forest Ecosystem Science at Oregon State University, video artist Julia Oldham has translated each frame of Phenocam timelapses from sites around the Cascadia region into palettes that represent the 10 most common colors in each photograph, abstracting the landscape into a color field. In September: Orange, Oldham sorts the grid of timelapse and palette sequences to find moments of color unity, when the landscapes all turn a similar shade. Restricting herself to images taken at 10:00 AM, she is looking for color patterns across seasons and years of data collection. What are the visible conditions when the landscape turns purple? What season is it when chartreuse is a dominant color in the palette?
Julia has a particular interest in the orange that regularly emerges in September throughout Cascadia, representing the color changes caused by yearly wildfire. Orange appears again and again, with increasing intensity, and floods the screens with evidence of smoke and heat. Significantly, Ameriflux US-Me2, one of the research towers used in this project and a primary source of data for Dr. Still, burned in a wildfire during summer of 2020.
The soundtrack for September: Orange combines field recordings from Oregon forests with data sonification. Julia mapped 10 years of fluctuating canopy greenness at Ameriflux US-Me6, a site at which she spent significant time this past year with Dr. Still and his colleagues and students, onto a hand-punched music box card. The resulting rising and falling melody can be heard throughout the video in various forms.